From the Founder’s Desk: Are We Starting a New Manufacturing Renaissance in America?
As we potentially enter a new era of US industrial policy, whether through tariffs or more federal actions and incentives, it’s worth looking back at our manufacturing industry, how we got to this moment, and where we might be headed.
I’ve been consulting for the past 30 years to communities across the US – most of whom have sought to grow their manufacturing jobs through recruitment, expansion, or retention. This “challenge” faced significant headwinds early in my career – specifically in 2001 when China entered the World Trade Organization and the US proceeded to lose six million manufacturing jobs that decade.
But has manufacturing been declining ever since? Thankfully, no. One bright spot in recent history is that our manufacturing job base has held steady for the last ten years and even shows positive growth if you start the clock during 2010 (the worst year of the “Great Recession”).
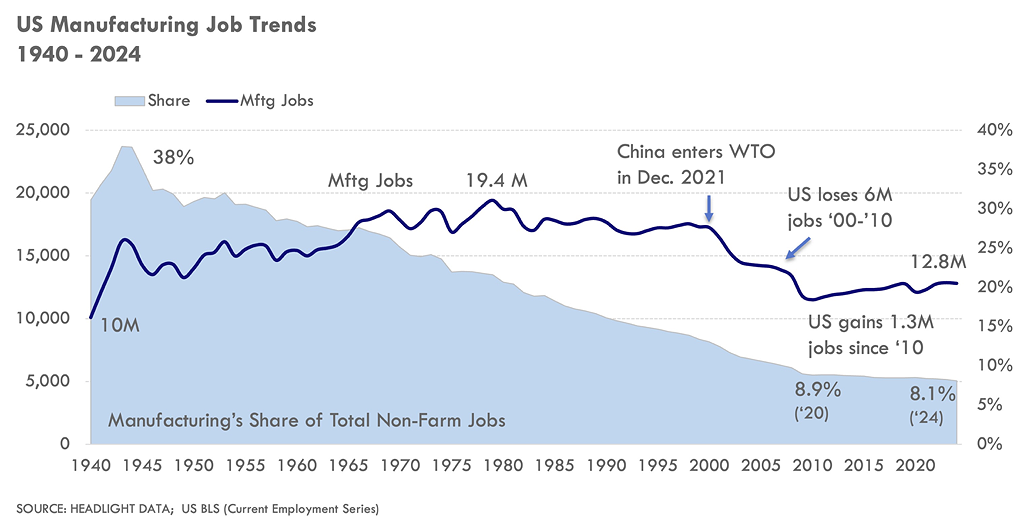
However, as shown by the bottom half of the chart, the percentage of US workers in manufacturing has been steadily declining since the early 1950s. Even with modest gains in manufacturing jobs since 2010, the industry’s share fell by nearly one percent. This “share of jobs” metric seems to only want to decline. But does it have to? Looking at how other countries have fared in the last 30 years shows some interesting insights.
Fortunately, the Organization for Economic Co-operation and Development (OECD) has been collecting data that tracks global manufacturing employment by country. Global manufacturing peaked in 2014 with 350 million workers and has declined since (available data is through 2020). China is by far the largest “owner” of manufacturing jobs, with a 40% share of global manufacturing workers. India comes in second with a 14% share, followed by Indonesia (5.4%) and then the United States (3.8%).
But who has won the “war for new jobs”? For the 25-year period from 1995 to 2020 (again, the most recent year available from the OECD), data shows that the US lost the most jobs as a percentage of our total manufacturing base – 28%. Mexico, China, and India experienced the opposite – positive, double-digit growth. And other countries in Asia grew even faster (Vietnam, Indonesia, and Malaysia). On a net new job basis, China gained two-thirds of all new manufacturing jobs created in the world.
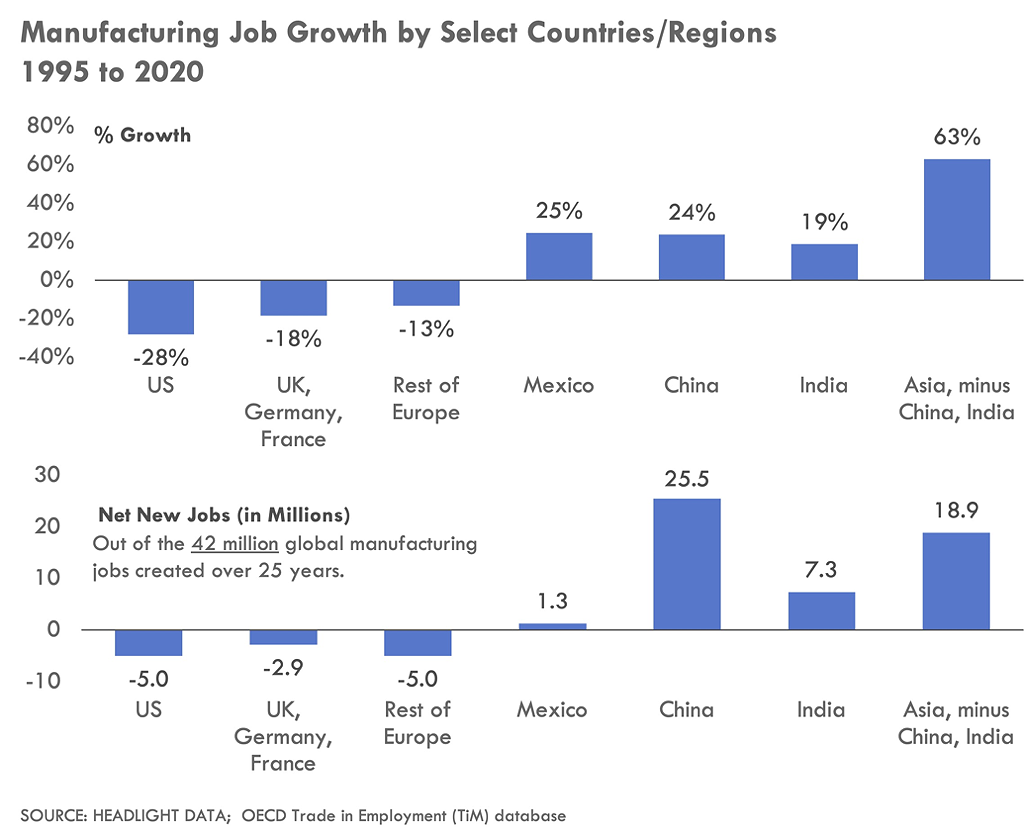
The subtext to the charts above isn’t the China story, or even the “Rest of Asia” story. In my opinion, the European experience is the story that should grab our attention. If our job loss rate (-28%) matched Europe’s (-15%) over the 25-year time period, we’d have 2.1 million more manufacturing jobs in the US.
So, rather than trying to compete with low-wage countries like China and India (who are also investing heavily in robotics), we should be asking what we can learn from Europe: Why did Europe perform so much better over the last three decades? How did Germany lose just 6% of its manufacturing jobs? What can we learn from what is happening in eastern Europe (such as relocating jobs to less costly rural areas, again)? What industries has Europe been able to retain or even grow? How does this compare to the American experience?
We’ll look at these questions in more detail in future articles. One positive benefit of the tariff discussion right now is the reminder that manufacturing is truly a global industry, so our analysis and thinking must be as broad as well.
- Chris Engle
Founder, Headlight Data