
Low-Wage Workers’ Pay Grew Faster Than High Earners’ in All 55 Large U.S. Metros Since 2015; High Earners’ Wages Fell in Nearly Half of Metros
After a 2005–2015 period in which gains went mostly to the top, wage growth from 2015 to 2025 ran the other way. At the bottom 10th percentile, the U.S. wage rose 22% after inflation, while the 90th percentile rose just 3%.
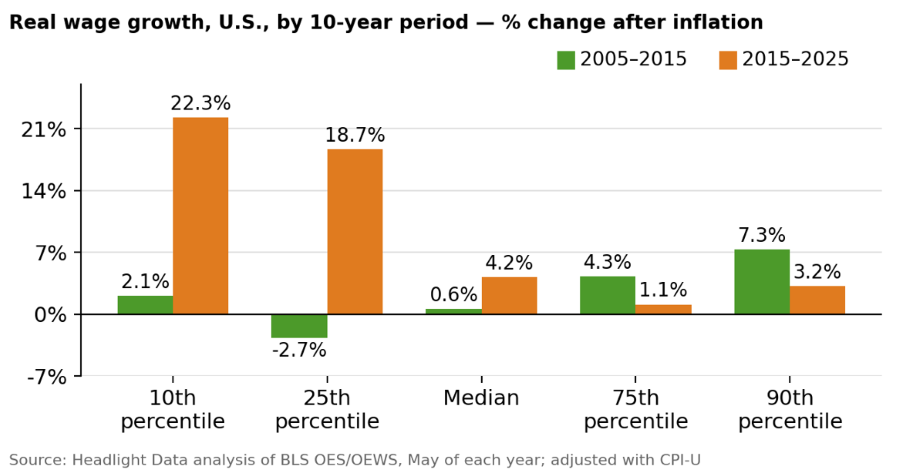
The pattern held across metros in the U.S. In every one of the nation’s 55 largest metros (1 million+ population), low-wage workers’ pay grew faster than both the median and the top 10%. That reverses the prior decade, when top earners’ pay grew faster than low-wage workers’ pay in 47 of the 55 metros, and real pay at the 25th percentile fell in 46 of them.

Low-wage pay rose fastest in Denver, Seattle, New York, Phoenix, and San Jose. Most of the leaders are in states or cities that raised their minimum wages well above the federal level, including Colorado (Denver), Washington (Seattle), New York (NYC), Arizona (Phoenix), and California (San Jose, San Diego, Los Angeles). The slowest low-wage growth came in Oklahoma City, Houston, Tulsa, and San Antonio, which are in states that still use the $7.25 federal minimum.
Seattle had the fastest median wage growth, followed by Orlando, Austin, Salt Lake City, and Portland. Three metros saw the real median decline: Houston, Hartford, and Cleveland.
At the top, gains were thin. Wages at the 90th percentile rose most in San Francisco, Tampa, Jacksonville, and Miami and fell furthest in Birmingham, Houston, Cleveland, and Indianapolis. Real 90th-percentile wages fell in 24 of the 55 metros.
About the data
Source: Headlight Data analysis of U.S. Bureau of Labor Statistics Occupational Employment and Wage Statistics (OEWS), May 2005, May 2015 and May 2025, all occupations, annual wages. Growth is adjusted for inflation using the CPI-U (U.S. city average, May to May): 22.3% for 2005–2015 and 35.2% for 2015–2025. Metros are the 55 metropolitan statistical areas with 1 million or more residents. The 2005 and 2015 estimates for Boston, Hartford and Providence are for New England City and Town Areas (NECTAs); the 2005 and 2015 estimates for Cleveland are for the former Cleveland-Elyria MSA; and the 2005 estimate for Los Angeles is for the former Los Angeles-Long Beach-Santa Ana MSA. Area definitions differ slightly between years. BLS cautions that OEWS estimates are not designed for time-series comparison. Still, a comparison of U.S. data from the Current Population Survey confirms the direction of the data – full-time low-wage earners saw faster growth in the most recent decade after trailing higher earners the previous decade. The CPS does not show the slowdown at the 90th percentile, however, so that finding rests on the OEWS alone.